• Exploring the World of Water Trading: Opportunities, Markets, and Strategies

    Exploring the World of Water Trading: Opportunities, Markets, and Strategies

    The Emergence of Water as a Tradable Commodity

    Water trading has become an increasingly significant aspect of global commodity markets, reflecting the growing recognition of water as a scarce and valuable resource. This concept involves the buying and selling of water rights or entitlements, allowing water to be transferred from areas of surplus to those facing scarcity. In this blog post, we’ll explore the intricacies of the water trading market, its leading players, examples, and how interested parties can get involved.

    Understanding Water Trading

    Water trading typically occurs in regions where water scarcity is a pressing issue. These markets are designed to allocate water more efficiently and sustainably, often through the use of water rights, which are legal entitlements to use a certain amount of water. The value of these rights fluctuates based on supply and demand dynamics, much like other commodities.

    Approximate Dollar Values and Market Dynamics

    Quantifying the global value of water trading markets is challenging due to the diverse nature of these markets and the varying costs of water across regions. However, in established markets like Australia and parts of the United States, the value of water trading can run into billions of dollars annually. For instance, Australia’s Murray-Darling Basin market saw transactions worth over AUD 2 billion in recent years.

    Leading Countries in Water Trading

    Australia: Often cited as a leading example, Australia has a well-developed water market, especially in the Murray-Darling Basin. The country has implemented sophisticated systems for trading water entitlements and allocations.

    United States: Certain states, like California and Colorado, have active water markets. These markets are essential for addressing the water needs of agriculture, urban areas, and environmental conservation.

    Chile: Known for its market-driven approach to water rights, Chile has a long history of water trading, utilized for both agricultural and industrial purposes.

    Examples of Water Trading

    • Temporary and Permanent Trades: In Australia, water trading can be either temporary (leasing rights for a season) or permanent (selling the rights entirely).
    • Environmental Water Purchases: Governments and conservation groups often purchase water rights to maintain environmental flows in rivers and wetlands.
    • Urban and Agricultural Trades: Urban areas may purchase water from agricultural users during drought periods.

    Getting Involved in Water Trading

    Understanding Legal Frameworks: Each region has specific laws and regulations governing water rights and trading. Understanding these legal frameworks is crucial.

    Market Research: Like any commodity market, water trading requires thorough market research to understand supply and demand dynamics, price trends, and risk factors.

    Working with Brokers and Platforms: Water trading often involves brokers or online platforms that facilitate transactions. Engaging with these entities can provide access to market opportunities and valuable insights.

    Sustainability and Ethical Considerations: It’s important to consider the sustainability and ethical implications of water trading, ensuring that transactions contribute to equitable and environmentally sound water management.

    Conclusion: A Market of Growing Importance

    Water trading represents a critical mechanism for addressing global water scarcity challenges. For commodity traders and investors, it offers a unique market with significant potential. However, successful involvement in water trading requires not only a sound understanding of market dynamics but also a commitment to sustainable and responsible water management practices. As the world increasingly recognizes the value of water, the water trading market is poised to expand, offering new opportunities for those prepared to navigate its complexities.

    Water Trading Image by rony michaud from Pixabay

  • China Dominates The Supply Of US Critical Minerals List

    China Dominates The Supply Of US Critical Minerals List

    Most countries have, for many decades, kept a record of their own critical minerals list.

    For example, the U.S., drew up a list of “war minerals” during World War I, containing important minerals which could not be found and produced in abundance domestically. They included: tin, nickel, platinum, nitrates and potash.

    Since then, as the economy has grown and innovated, critical mineral lists have expanded considerably. The Energy Act of 2020 defines a critical mineral as:

    “A non-fuel mineral or mineral material essential to the economic or national security of the U.S., whose supply chains are vulnerable to disruption.”

    – ENERGY ACT, 2020.

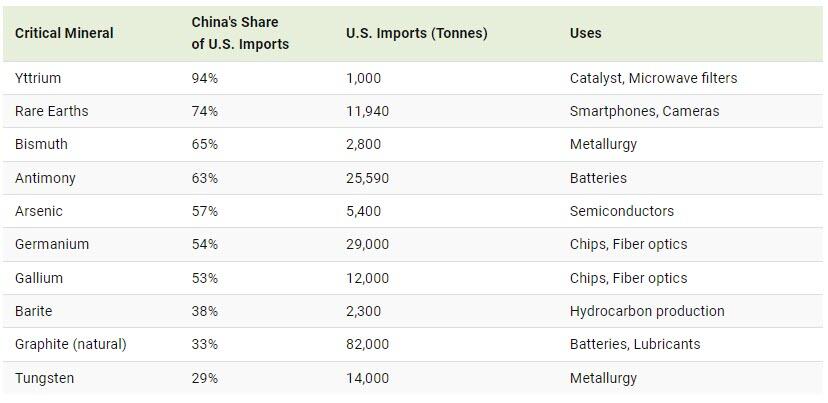
    Currently there are 50 entries on this list and the U.S. Geological Survey (USGS) estimates that China is the leading producer for 30 of them. From USGS data, Visual Capitalist’s Marcus Lu visualizes China’s share of U.S. imports for 10 critical minerals.

    What Key Critical Minerals Does the U.S. Import From China?

    The U.S. is 100% import-reliant for its supply of yttrium, with China responsible for 94% of U.S. imports of the metal from 2018 to 2021.

    A soft silvery metal, yttrium is used as an additive for alloys, making microwave filters for radars, and as a catalyst in ethylene polymerization—a key process in making certain kinds of plastic.

    China is a major supplier of the following listed critical minerals to the U.S.

    Note: China’s share of U.S. critical minerals imports is based on average imports from 2018 to 2021.

    Meanwhile, the U.S. also imports nearly three-quarters of its rare earth compounds and metals demand from China. Rare earth elements—so called since they are not found in easily-mined, concentrated clusters—are a collection of 15 elements on the periodic table, known as the lanthanide series.

    ℹ️ Yttrium and scandium exhibit similar rare-earth properties, and are found in the same ore bodies. They are often grouped together with the lanthanide series.

    Rare earths are used in smartphones, cameras, hard disks, and LEDs but also, crucially, in the clean energy and defense industries.

    Does China’s Dominance of U.S. Critical Minerals Supply Matter?

    The USGS estimates that China could potentially disrupt the global rare earth oxide supply by cutting off 40–50% production, impacting suppliers of advanced components used in U.S. defense systems.

    A version of this sort of trade warfare is already playing out. Earlier this year, China implemented export controls on germanium and gallium. The U.S. relies on China for around 54% of its demand for both minerals, used for producing chips, solar panels, and fiber optics.

    China’s controls were seen as a retaliation against the U.S. which has restricted the supply of chips, chip design software, and lithography machines to Chinese companies.

    Source: Zero Hedge

    Critical Minerals Photo credit Wikipedia: Yttriumsublimeddendritic, high purity 99.99 % Y/TREM. As well as an argon arc remelted 1 cm3 yttrium cube for comparison. Purity 99.9 %.

  • Shining Bright: The Top 5 Silver Exporters and Their Major Importers

    Shining Bright: The Top 5 Silver Exporters and Their Major Importers

    Welcome to the latest blog post on CommodityTrader.com, where we delve into the fascinating world of silver trading. Silver, a precious metal known for its lustrous shine and myriad of industrial applications, is a key player in the global commodities market. Today, we explore the top five silver exporters, their major importing partners, and the approximate dollar values involved in these trades.

    1. Mexico – The Silver Powerhouse

    Mexico is renowned as the world’s largest silver exporter. The country’s rich deposits and advanced mining industry make it a heavyweight in the silver market.

    Major Importers: The United States and Canada are primary importers of Mexican silver, with significant quantities also going to various European and Asian countries.

    Approximate Export Value: Mexico’s silver exports are valued at approximately $5 billion annually, reflecting its dominance in the global market.

    2. Peru – Silver and History Intertwined

    Peru’s history is deeply intertwined with silver mining, dating back to the colonial era. Today, it stands as one of the leading exporters of this precious metal.

    Major Importers: China and India are major destinations for Peruvian silver, signifying the growing demand in Asian markets.

    Approximate Export Value: Silver exports from Peru are estimated to be around $3 billion per year, showcasing its significant role in the global silver trade.

    3. China – A Dual Role Player

    China not only ranks as one of the top exporters of silver but also as one of the largest consumers. This dual role underscores China’s integral position in the silver market.

    Major Importers: Hong Kong and the United States are key importers of Chinese silver, aligning with broader trade patterns.

    Approximate Export Value: China’s silver exports are valued at approximately $2 billion annually, a figure that reflects its balanced role as both a major producer and consumer.

    4. Poland – Europe’s Silver Contributor

    Poland contributes significantly to the European silver market, with its advanced mining technology and rich deposits.

    Major Importers: Germany and the United Kingdom are leading importers of Polish silver, indicating strong intra-European trade relations.

    Approximate Export Value: Polish silver exports stand at around $1.5 billion per year, marking its prominence in the European market.

    5. Chile – The Rising Competitor

    Chile, traditionally known for its copper production, has been steadily increasing its presence in the silver export market.

    Major Importers: Brazil and Argentina are notable importers of Chilean silver, reflecting South America’s dynamic commodity trade.

    Approximate Export Value: Chile’s annual silver exports are estimated at $1 billion, highlighting its growing influence in the global silver market.

    World production of silver

    World production of silver

    Silver Exporters Conclusion:

    The global silver market is a dynamic and vital component of the world’s commodity trade. The intricate balance of export and import among these top players not only reflects the economic prowess of these countries but also the ever-evolving demand and supply chains in the precious metals market.

    Stay tuned to CommodityTrader.com for more insights into the world of commodity trading, where we bring you the latest trends, analysis, and news from the heart of global trade.

    Disclaimer: The figures mentioned are approximate and subject to change based on market conditions. Always conduct thorough research and consult with financial experts before making trading decisions.

    Note: The blog post is intended to be informative and engaging, providing readers with a snapshot of the global silver market. The data provided should be verified for accuracy as market conditions can fluctuate.

  • British Columbia’s Forest Sector: A Pillar of Economic Strength and Innovation

    British Columbia’s Forest Sector: A Pillar of Economic Strength and Innovation

    A Robust Contributor to British Columbia’s Economy

    In the realm of commodity trading, the forest sector of British Columbia (B.C.) stands out as a remarkable example of economic resilience and innovation. In 2020, this sector not only employed about 43,000 people but also contributed significantly to the province’s economy, making up 29% of B.C.’s total commodity export value. This translates to an impressive $11.5 billion, highlighting the sector’s critical role in both the local and global markets.

    The Unique Qualities of British Columbia’s Softwood

    Central to this success is the unique nature of British Columbia’s softwood tree species. These trees are characterized by long, slender, thin-walled fibers, which are highly sought after for their exceptional properties. When processed, these fibers create pulp with excellent tensile strength, consistency, and sheet dimensional stability. These characteristics make B.C.’s softwood pulp ideal for a range of high-quality paper products.

    Diverse Range of Paper Products

    The province’s mills are adept at transforming this valuable resource into a variety of essential products. Here’s an approximate breakdown of the key paper products manufactured from B.C.’s softwood:

    Newsprint: B.C.’s mills produce a significant amount of newsprint, which remains in demand for newspapers and advertising materials. Despite digital media’s rise, newsprint from B.C. continues to be a vital export product.

    Specialty Papers: These include a variety of papers with specific properties for unique applications, like thermal papers, label papers, and others. B.C.’s mills are known for their ability to customize products to meet specific customer needs.

    Tissue and Towelling: Softwood pulp’s high strength and absorbency make it ideal for producing high-quality tissue papers and towelling products. These everyday essentials form a substantial part of the forest sector’s output.

    Containerboard and Paperboard: These materials are essential for packaging and shipping, with uses ranging from cardboard boxes to protective packaging. The strength and durability provided by B.C.’s softwood fibers make these products particularly reliable.

    Economic Impact and Sustainability

    The forest sector’s contribution to B.C.’s economy extends beyond direct exports. It plays a vital role in supporting ancillary industries, from transportation and logistics to research and development. Moreover, there is a growing emphasis on sustainable and environmentally friendly practices within the sector, ensuring that this natural resource continues to support future generations.

    Conclusion: A Testament to Natural Resources and Innovation

    In conclusion, British Columbia’s forest sector is not just a major contributor to the province’s economy; it’s a testament to how natural resources, when managed innovatively and sustainably, can create diverse and high-value products that resonate in global markets. For commodity traders, B.C.’s forest sector represents a source of high-quality, sustainable products with a stable and growing market presence. As we look to the future, the sector’s commitment to sustainability and innovation positions it well to continue its role as a key player in the global commodity market.

  • South Africa’s Coal Industry: A Key Player in Global Energy Markets

    South Africa’s Coal Industry: A Key Player in Global Energy Markets

    Unveiling the Powerhouse of Coal Production and Export

    As a resource-rich nation, South Africa stands tall as one of the seven largest coal-producing and one of the top five coal-exporting countries in the world. This distinction not only highlights South Africa’s pivotal role in the global coal industry but also underscores the importance of its coal exports in international energy markets. In this blog post, we’ll explore South Africa’s coal export landscape, including key importing nations, dollar values, prices, and shipping costs, providing valuable insights for commodity traders.

    South Africa’s Coal Dominance

    South Africa’s coal mining industry is a critical part of its economy and energy sector. More than a quarter of the coal mined in the country is destined for the international market. The majority of these exports depart from the Richards Bay Coal Terminal, the world’s largest coal export facility, which serves as a vital link between South African coal producers and the global market.

    Key Importing Nations

    South African coal finds its way to various corners of the globe. The primary importers include countries in Europe, Asia, and Africa. Notably, India, China, South Korea, and Japan are among the largest importers, driven by their substantial energy needs. European nations also feature prominently, with countries like the Netherlands and Germany relying on South African coal for their energy mix.

    Market Values and Prices

    The dollar value of South African coal exports represents a significant part of the country’s export revenue. However, the exact figures fluctuate based on global coal prices, exchange rates, and demand dynamics. As of the latest data available, South African coal prices varied, influenced by factors like coal grade, calorific value, and international market trends.

    For instance, thermal coal prices from South Africa might range significantly, reflecting variations in quality and market conditions. These prices are also subject to change due to geopolitical events, environmental policies, and shifts in global energy demand.

    Shipping Costs and Logistics

    Shipping costs play a crucial role in the coal export business. The cost of transporting coal from South Africa to international destinations varies based on several factors, including shipping routes, fuel prices, and freight rates. For example, the cost of shipping coal to Asia is influenced by maritime routes and the distance covered, whereas shipping to European destinations might incur different costs.

    The Richards Bay Coal Terminal’s efficiency and capacity significantly impact these logistics, as it dictates how quickly and effectively coal can be loaded onto ships and dispatched to various global destinations.

    Promoting Our Premium Coal Supplier: High-Quality Specifications Meet Global Demand

    Superior Coal from South Africa’s Richards Bay

    As we explore the dynamics of South Africa’s coal industry, it’s essential to highlight our supplier’s exceptional product offerings. Sourced directly from the renowned export terminals at Richards Bay, our coal meets the highest standards, ensuring satisfaction for a range of international clients. Let’s delve into the specifications that set our coal apart.

    RB1 and RB3 Coal: Exemplifying Excellence

    Our supplier specializes in providing two primary types of coal: RB1 and RB3. These varieties are not only popular in the market but also come with assurances of quality and performance.

    RB1 Coal Specifications:
    • Calorific Value (Basis): 6,000 kcal/kg NCV (Net Calorific Value)
    • Calorific Value (Minimum): 5,850 kcal/kg NCV
    • Total Moisture (ARB): Maximum of 12.0%
    • Volatile Matter (ARB): Minimum of 22.0%
    • Ash (ARB): Maximum of 15.0%
    • Sulphur (ARB): Maximum of 1.0%
    • Hardgrove Grindability Index (HGI): 45-70
    • Nominal Topsize: 50mm
    • Initial Deformation Temperature (IDT – Reducing Atmosphere): Minimum 1,250° C
    • Calcium Oxide in Ash (DB): Maximum 12.0%
    RB3 Coal Specifications:
    • Calorific Value (Basis): 5,500 kcal/kg NCV
    • Calorific Value (Minimum): 5,300 kcal/kg NCV
    • Total Moisture (ARB): Maximum of 14.0%
    • Volatile Matter (ARB): Maximum of 22.0%
    • Ash (ARB): Maximum of 23.0%
    • Sulphur (ARB): Maximum of 1.0%
    • Hardgrove Grindability Index (HGI): 45-70
    • Nominal Topsize: 50mm
    • Initial Deformation Temperature (IDT – Reducing Atmosphere): Minimum 1,250° C
    • Calcium Oxide in Ash (DB): Maximum 12.0%

    Flexible Trading Options

    We understand that market conditions and client needs vary. Therefore, we offer contracts that can be traded on a fixed price or on an index-linked basis, specifically referencing the API4 index. This flexibility allows our clients to choose the trading arrangement that best suits their risk management strategies and market predictions.

    Commitment to Quality and Consistency

    Our supplier’s commitment to delivering coal that consistently meets these specifications is unwavering. We understand that quality and reliability are paramount in the coal industry, and our sourcing from South Africa’s Richards Bay ensures that we provide coal that not only meets but often exceeds international standards.

    Conclusion: A Partner in Energy

    In conclusion, our supplier stands as a beacon of quality and reliability in the global coal market. With our RB1 and RB3 coal offerings, we are poised to meet the diverse needs of the international community, backed by the assurance of superior quality, flexible trading options, and consistent supply. For those in the commodity trading sector looking for a dependable coal source, our supplier represents an ideal choice, capable of fulfilling even the most demanding requirements.

    Photos by Joey Harris on Unsplash and Анатолий Стафичук from Pixabay

  • Understanding Soft and Hard Commodities: A Comprehensive Guide for Commodity Traders

    Understanding Soft and Hard Commodities: A Comprehensive Guide for Commodity Traders

    In the world of commodity trading, understanding the distinction between soft and hard commodities is crucial. These two categories encompass a wide range of products, each with unique market dynamics, trading strategies, and economic implications. In this blog post, we’ll delve into the specifics of soft and hard commodities, including their approximate dollar values, to offer a clear understanding for commodity traders.

    Soft Commodities: Nature’s Bounty

    Soft commodities refer to agricultural products and livestock. They are typically grown and harvested, rather than mined or extracted. This category includes:

    Agricultural Crops: Wheat, corn, soybeans, coffee, sugar, and cotton are prime examples. The prices for these commodities fluctuate based on weather conditions, harvest yields, and global demand. For instance, as of my last update in April 2023, the approximate dollar values per metric ton were: wheat ($280), corn ($250), and soybeans ($520).

    Livestock: This includes cattle, hogs, and poultry. Livestock prices depend on feed costs, herd sizes, and meat demand. For example, live cattle were trading around $1.20 per pound.

    Soft commodities are often more susceptible to spoilage and seasonal fluctuations compared to hard commodities.

    Hard Commodities: The Extracted Essentials

    Hard commodities are natural resources that are mined or extracted. They fall into two main categories:

    Metals: This includes precious metals like gold and silver, and industrial metals like copper, aluminum, and iron ore. Gold, often considered a safe haven asset, had an approximate value of $1,950 per ounce, while copper traded around $9,500 per metric ton.

    Energy: Key energy commodities are crude oil, natural gas, and coal. These commodities are critical to the global economy, with prices influenced by geopolitical events, technological advancements, and changes in energy policies. For instance, Brent crude oil was trading at about $70 per barrel.

    Hard commodities are typically less susceptible to spoilage and can be stored for longer periods, making them a popular choice for long-term investments.

    Market Value and Economic Impact

    The total market value of commodities fluctuates based on various factors, including supply and demand dynamics, geopolitical events, and macroeconomic trends. As of my last update, the global commodities market was valued in the trillions of dollars, with hard commodities generally having a higher total value due to their extensive industrial and economic uses.

    Trading Considerations

    Commodity traders should consider several factors when dealing with soft and hard commodities:

    • Volatility: Soft commodities are often more volatile due to their susceptibility to weather conditions and seasonal cycles. Hard commodities, while also volatile, are influenced more by economic cycles and industrial demand.
    • Storage and Transportation: Hard commodities are typically easier to store and transport over long periods, whereas soft commodities require more specialized handling due to their perishable nature.
    • Market Access: Futures markets are a common way to trade both soft and hard commodities. However, the entry barriers, contract sizes, and margin requirements can vary.

    Conclusion: A Balanced Portfolio

    For commodity traders, understanding the nuances between soft and hard commodities is essential for developing a balanced trading strategy. By recognizing the different factors that influence each type of commodity, traders can make more informed decisions, adapt to market changes, and potentially capitalize on the unique opportunities each market offers. Remember, the values mentioned are subject to change and should be used as a reference point for understanding market dynamics rather than absolute figures for trading.

    Photo by Erwan Hesry on Unsplash

  • Navigating the Global Market: The Dynamics of Pork Belly Imports and Exports

    Navigating the Global Market: The Dynamics of Pork Belly Imports and Exports

    A Deep Dive into the Pork Belly Trade

    In the intricate web of global trade, pork belly stands out as a fascinating commodity. This cut of pork, known for its rich flavor and versatility, has a significant presence in international markets. This blog post explores the nuances of pork belly imports and exports, shedding light on the factors that drive this trade and its impact on the global economy.

    Understanding Pork Belly’s Global Appeal

    Pork belly, the cut from which bacon is made, is a staple in many cuisines worldwide. Its popularity spans continents, from the savory bacon in American breakfasts to the succulent slices in Korean samgyeopsal. This widespread demand underpins the global trade of pork belly, making it a valuable commodity in the international market.

    Key Players in Pork Trade

    Several countries lead the charge in the production and export of pork belly. Notably, the United States, European Union, and Canada are significant exporters. They have well-established pork industries capable of meeting both domestic and international demands. On the import side, countries like Japan, South Korea, and China are prominent players. Their high consumption rates drive the need for imports, particularly from countries with surplus production.

    Market Dynamics and Trends

    The pork market is influenced by various factors, including dietary trends, health concerns, and cultural preferences. Economic factors such as currency exchange rates, trade agreements, and tariffs also play a crucial role. For instance, trade disputes can lead to tariffs that impact the flow of pork belly between countries, affecting prices and supply chains.

    Environmental and health factors, like outbreaks of diseases such as African Swine Fever (ASF), can significantly disrupt pork belly trade. These outbreaks can lead to culling of swine herds, affecting supply and, subsequently, international trade dynamics.

    Challenges and Opportunities

    Exporting nations face challenges like maintaining product quality during transport, adhering to the importing countries’ food safety standards, and dealing with the volatility of commodity prices. Conversely, there are opportunities in exploring new markets, improving sustainable and ethical farming practices, and adapting to changing consumer preferences.

    For importing nations, challenges include dependency on external markets for supply and potential fluctuations in import costs. Opportunities lie in diversifying import sources and investing in domestic pork production to reduce reliance on imports.

    The Impact of COVID-19 Pandemic

    The COVID-19 pandemic has significantly impacted the commodity trade. Supply chain disruptions, changes in consumer behavior, and shifts in trade policies have all played a role in altering the landscape of pork belly imports and exports.

    Looking Ahead

    As we look to the future, the pork belly market is expected to continue evolving. Factors like global economic recovery post-pandemic, changing dietary trends, and technological advancements in pork production and transportation will shape the future of pork belly trade.

    Conclusion: A Vital Commodity in Global Trade

    In conclusion, pork’s role in global trade is complex and multifaceted. As a commodity, it not only satisfies culinary tastes but also represents significant economic value for countries involved in its trade. Understanding the dynamics of pork imports and exports is crucial for stakeholders in this market, from farmers to traders and policymakers, as they navigate the challenges and capitalize on the opportunities in this ever-changing landscape.

    Photo by amit Majhi on Unsplash

  • Exploring the Lucrative World of Carbon Emissions Credits, Renewable Energy Certificates, and Weather Derivatives

    Exploring the Lucrative World of Carbon Emissions Credits, Renewable Energy Certificates, and Weather Derivatives

    In a world grappling with the consequences of climate change, environmental sustainability has become a paramount concern. Governments, businesses, and individuals are increasingly seeking ways to reduce their carbon footprint and invest in renewable energy sources. This shift towards sustainability has given rise to three intriguing financial instruments: Carbon Emissions Credits (CECs), Renewable Energy Certificates (RECs), and Weather Derivatives. In this blog, we will delve into these opportunities and explore how they can benefit both the environment and your bottom line.

    Carbon Emissions Credits (CECs)

    Carbon Emissions Credits, commonly referred to as carbon offsets, have gained substantial prominence in recent years as a means of combating climate change. CECs allow organizations and individuals to compensate for their carbon emissions by investing in projects that reduce greenhouse gases elsewhere. These projects can range from reforestation initiatives and renewable energy installations to methane capture from landfills.

    Opportunities:
    Financial Incentives: Investing in CECs can provide financial incentives and tax benefits for businesses and individuals alike.
    Compliance: Companies in regulated industries can use CECs to meet emissions reduction targets imposed by governments and international agreements.
    Sustainability Branding: Purchasing CECs can help businesses enhance their sustainability image and appeal to environmentally-conscious consumers.

    Renewable Energy Certificates (RECs)

    RECs are a market-based solution to promote the adoption of renewable energy sources. These certificates represent the environmental attributes of one megawatt-hour (MWh) of electricity generated from renewable sources, such as wind, solar, or hydro power. By purchasing RECs, individuals and businesses can support the expansion of renewable energy production.

    Opportunities:
    Green Energy Adoption: RECs enable consumers to support and invest in clean energy without the need for expensive infrastructure installations.
    Sustainability Goals: Companies can use RECs to meet renewable energy targets and reduce their carbon footprint.
    Competitive Advantage: Businesses that prioritize sustainability can gain a competitive edge by showcasing their commitment to clean energy.

    Weather Derivatives

    Weather derivatives are financial contracts that allow businesses to hedge against the impact of adverse weather conditions on their operations or revenues. These contracts are often used in industries heavily influenced by weather patterns, such as agriculture, energy, and tourism.

    Opportunities:
    Risk Mitigation: Weather derivatives can protect businesses from financial losses caused by unexpected weather events, such as hurricanes, droughts, or extreme temperatures.
    Increased Stability: By using weather derivatives, companies can stabilize their revenues and reduce uncertainty, making them more resilient to climate-related risks.
    Investment Diversification: Weather derivatives offer a unique way to diversify an investment portfolio, particularly for investors interested in commodities or weather-sensitive industries.

    Conclusion

    Carbon Emissions Credits, Renewable Energy Certificates, and Weather Derivatives are three distinct financial instruments that offer a range of opportunities for individuals and businesses. Not only do they allow for responsible environmental stewardship, but they also provide avenues for financial gain and risk mitigation.

    As the world continues to grapple with the pressing issue of climate change, these opportunities are likely to grow in importance. By participating in these markets, you can not only contribute to a more sustainable future but also explore avenues for financial growth and stability. Whether you’re looking to offset your carbon emissions, support clean energy, or protect your business from weather-related risks, these instruments offer promising pathways to achieve your goals. It’s time to embrace these opportunities and play your part in building a greener and more resilient world.

    Photo by Andreas Gücklhorn on Unsplash

  • Rhodium: The Precious Metal Shaping the Future of Commodity Trading

    Rhodium: The Precious Metal Shaping the Future of Commodity Trading

    The Rising Star in the Precious Metals Market

    In the dynamic world of commodity trading, rhodium has emerged as a significant and intriguing player. This rare and precious metal, often overshadowed by its more famous counterparts like gold and silver, has been carving out a niche for itself, especially in the realm of industrial applications and investment.

    What is Rhodium?

    Rhodium is a rare, silver-white metallic element that is highly reflective and resistant to corrosion. It is part of the platinum group metals (PGMs), which also include platinum, palladium, iridium, osmium, and ruthenium. What sets rhodium apart is its scarcity and the unique properties it offers, making it highly valuable for various industrial uses.

    Industrial Applications: The Driving Force

    The primary demand for rhodium comes from the automotive industry, where it is used in catalytic converters to reduce harmful emissions from vehicles. This metal plays a crucial role in environmental protection efforts, making it increasingly relevant in today’s eco-conscious world. Additionally, rhodium is used in the chemical industry for its catalytic properties and in the manufacturing of specialized glass and electronics.

    The Investment Perspective

    From an investment standpoint, rhodium presents a unique opportunity. Its price is primarily driven by supply-demand dynamics, with the limited supply playing a significant role in its valuation. The rarity of rhodium, combined with its essential industrial uses, creates a scenario where the metal can see significant price movements, making it an attractive option for commodity traders and investors looking for diversification in their portfolios.

    Market Dynamics and Volatility

    The rhodium market is known for its volatility, a characteristic that can be attributed to its tight supply and the specific nature of its demand. The majority of rhodium supply comes from South Africa, followed by Russia, making it susceptible to geopolitical and economic factors in these regions. Additionally, changes in the automotive industry, such as the shift towards electric vehicles, can impact the demand and price of rhodium.

    The Future Outlook

    Looking ahead, the future of rhodium in commodity trading seems promising yet unpredictable. The ongoing push for cleaner emissions and the metal’s role in catalytic converters suggest a steady demand, at least in the near term. However, advancements in technology and changes in environmental regulations could alter the landscape significantly.

    Conclusion: A Niche Commodity with Potential

    In conclusion, rare earth metals represents a niche yet potentially lucrative commodity for traders and investors. Its unique properties, critical industrial uses, and the dynamics of its supply and demand make it an exciting, albeit volatile, addition to the world of commodity trading. As with any investment, understanding the market, staying abreast of industry developments, and a strategic approach are key to navigating the rhodium market’s complexities and capitalizing on its potential.

  • Grain Market Shake-Up: Corn and Wheat Prices Experience Largest Yearly Decline in a Decade

    Grain Market Shake-Up: Corn and Wheat Prices Experience Largest Yearly Decline in a Decade

    In a surprising turn of events, the commodity markets have witnessed a significant drop in corn and wheat prices, marking the largest yearly decline in a decade. This development comes as a ray of hope for consumers and policymakers alike, as it hints at the potential easing of food inflation. In this blog post, we will delve into the factors behind this unprecedented decline and the implications it holds for the commodity trading landscape.

    Factors Behind the Price Decline:
    Several interconnected factors have contributed to the drastic drop in corn and wheat prices, catching many commodity traders off guard. Understanding these elements is crucial for comprehending the broader market dynamics:

    Global Supply Surplus:
    The year has seen an unexpected surge in global grain production, resulting in a surplus of corn and wheat supplies. Favorable weather conditions in major producing regions, coupled with advancements in agricultural technologies, have led to bumper crops, surpassing initial market expectations.

    Improved Trade Relations:
    Geopolitical developments have played a pivotal role in shaping commodity prices. Improved trade relations between major grain-exporting nations have facilitated smoother cross-border transactions, reducing trade barriers and supporting a more fluid market.

    Innovation in Agriculture:
    Ongoing innovations in agricultural practices, including precision farming and the use of advanced machinery, have enhanced productivity and minimized losses. These advancements have contributed to increased yields and improved efficiency in the production of corn and wheat.

    Stable Energy Prices:
    The stability in energy prices has alleviated concerns about the cost of production and transportation, thereby positively impacting the overall cost structure of corn and wheat. As energy prices remain relatively steady, the cost pressures on farmers and traders have eased.

    Implications for Commodity Traders:
    The sudden decline in corn and wheat prices poses both challenges and opportunities for commodity traders. Here’s a closer look at how traders might navigate this evolving landscape:

    Diversification Strategies:
    Traders may need to reevaluate their portfolios and consider diversifying into other commodities or adjusting their positions based on the changing dynamics of the corn and wheat markets.

    Risk Management:
    With market conditions being unpredictable, effective risk management becomes paramount. Traders should employ hedging strategies to protect against potential price reversals or unforeseen geopolitical events that could impact the commodity markets.

    Monitoring Global Trends:
    Staying informed about global trends, including weather patterns, trade policies, and technological advancements, will be essential for traders looking to anticipate and adapt to future changes in the commodity markets.

    Conclusion:
    The significant decline in corn and wheat prices offers a glimmer of hope for consumers facing food inflation concerns. While commodity traders navigate the complexities of these evolving markets, the broader implications of this price drop extend beyond financial markets to impact global food security and supply chains. As we move forward, vigilance and adaptability will be key for both traders and stakeholders in the agricultural sector.

    Grain Market Image by Albrecht Fietz from Pixabay